This study undertook repeated measurements using a process safety culture (SC) maturity survey across 14 major hazard companies from 2012 to 2018, adding an additional 5 companies in 2018 for additional comparison.
Recognising the multitude of SC definitions and aspects, the authors took a pragmatist view, focusing on safety relevant practices (what they termed “manifestations of safety culture”), e.g. “the way we do things around here”. They explored culture in the framing of attitudes, values, (implicit) assumptions, perceptions and habits of members of the organisation relevant to dealing with process safety risks.
In their working definition, safety culture was regarded as part of the broader organisational culture.
They also drew on concepts from a normative SC maturity concept. For balance however, they cited a recent critical review of SC maturity model where the authors argued that “maturity models imply that organizations make steady progress on a journey that takes them from low levels of safety towards an optimal state” and that “maturity models lack a theoretical basis to explain the maturity process and its suggested steady progress in safety” (p8).
They also asked interviewees to reflect on safety practices and on the prevailing SC.
For context, they provide some common challenges within the SC domain:
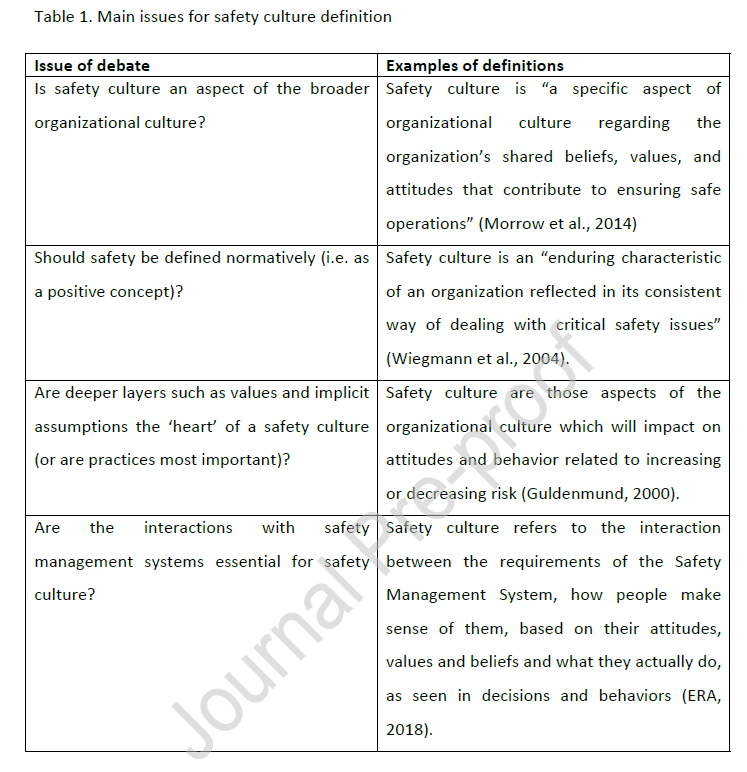
Results
Consistently good or excellent scores in 2012 were a good predictor for adequate SC survey levels 6 years later – also indicating that SC can be improved over 6 years from a below acceptable level to good.
SC survey performance can develop positively or negatively over time. Over time, 6 companies improved their SC; in 4 it was similar; and another 4 it was lower than in 2012.
In general, SC was highest higher up the supply chain and worsened the lower down the supply chain (refineries > chemical industry > bulk storage > chemical warehousing and logistics), with warehousing and logistics generally being lower. This difference lessened in 2018 compared to 2012, but “the more problematic [SC] were found at the lower end of the supply chain” (p25).
In companies with a good SC maturity score, more positive observations were found – compared to companies with lower scores, where less positive observations were found. According to authors, this helps strengthen the validity of the SC scores.
As indicated, consistency or inconsistency in SC levels was shown to be an important predictive factor for future performance, whereas the reverse for lower initial SC was found. They suggest that maturity levels are not distinct levels but rather points on a sliding scale.
Results indicate that SC maturity is not an “autonomous process” and that higher SC must be actively maintained. They suggest that their findings, in this sample, may question the concept of a SC “maturing process”.
Further, they suggest that “the concept of ‘safety culture maturity process’ should be replaced by ‘safety culture development process’ and that the concept of ‘safety culture maturity levels’ should be replaced by ‘safety culture development levels’” (p30).
Authors couldn’t test which safety interventions were most effective for SC survey performance. However, interviewees reported a range of factors, including: investment in training & competence; SC programs; leadership programs; better employee involvement & engagement; & more involvement with supply partners.
One observation was that senior management in one company that received a “not-so-good” SC score were quite happy with the result. It’s reasoned that the management could use this finding to convince shareholders to increase safety funding.
Authors: Zwetsloot, G. I., van Middelaar, J., & van der Beek, D. (2020). Journal of Cleaner Production, 257, 120540.
Study link: https://doi.org/10.1016/j.jclepro.2020.120540
Link to the LinkedIn article: https://www.linkedin.com/pulse/repeated-assessment-process-safety-culture-major-ben-hutchinson
