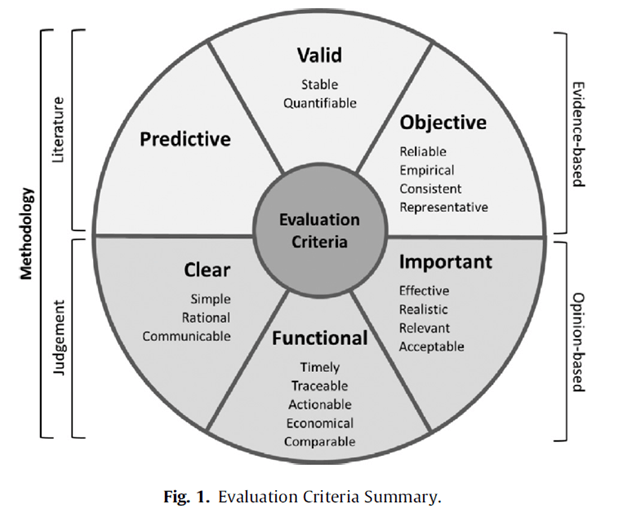
This study evaluated safety performance indicators against a set of pre-determined criteria to assess the quality of indicators. This included against more objective criteria and also qualitative criteria (assessed via expert groups).
The objective quality criteria were: objective, valid, predictive, while the subjective criteria were: clear, functional, and important (see the paper for full definitions).
Then they discussed the findings from evaluating indicators against the criteria and how to more effectively combine indicators to make up for individual weaknesses in an indicator.
Providing background they note
· While injury rates like TRIR etc. remain the predominant construction safety performance metrics, recent research shows “that injury rates have severe philosophical and statistical limitations” (p1)
· Injury rates have been criticised for being retrospective in nature, fraught with underreporting and “manipulation through case management” (p1)
· Misleading due to injuries of different severity levels being treated as numerically equal
· “Statistically, injury rates such as TRIR are invalid for nearly all practical purposes because injuries are relatively rare and almost completely random in their distribution” (pp1-2, emphasis added)
· Further, “since the timing and distribution of recordable injuries is approximately 98% random and injuries are numerically rare (e.g., 1 per 200,000 worker 114 hours), TRIR is not statistically meaningful unless it is derived from hundreds of millions of worker hours. Thus, using TRIR to make consequential business decisions most often rewards or penalizes random variation” (p2, emphasis added)
· One study indicated that recordable injury rates “do not statistically indicate future safety performance” (p2)
· Also there’s a range of issues relating to inconsistent definitions on what constitutes an injury, near miss etc.
· Precursors are another avenue of indicators. Two cited studies found incident precursors differentiated no-injury circumstances from serious injury and fatality conditions
· Safety climate is another frequently used measure, and generally measured via perception surveys. Higher safety climate scores have been linked to lower injury rates
Not presenting all of the findings for each criteria, so you’ll need to read the full paper.
Results
Objective criteria-
All injury rates (e.g. first aids, TRIR, DART) received a top score for objective, since they’re based on consistent definitions.
For predictive capacity – TRIR and DART were found to not be predictive over reasonable timeframes (less than 8 years). No empirically validated studies have thus far tested the predictive capacity of first aid or fatality rates.
First aid rates were given a top score for validity because they are relatively frequent and thus “could theoretically produce statistical stability if reported regularly and consistently” (p6).
However, all other injury rates received zero scores for validity since they are “exceedingly rare and randomly distributed, leading to statistical instability” (p6)
Near misses received a zero score for objective since they are too open to interpretation about what constitutes a near miss; making comparison between groups difficult. No research was noted to have been undertaken confirming near misses to be predictive, nor whether near miss incident reporting generates enough volume of events to be statistically stable – receiving a half-mark for validity and predictive.
Leading indicators: Here the authors note that because research has found leading indicators to be “based on directly observable activities, collected in high volume in safety management systems, and are directly associated with future safety performance (Poh et al., 2018; Salas & Hallowell, 2016; and Versteeg et al., 2019), leading indicators were assigned a value of 1 [the top score] for valid, objective, and predictive, respectively” (p7) .
Precursor analysis scores: Precursors were assigned a top score for predictive and valid, but zero for objective since precursor scores are said to be derived from interpretation by the observer.
Safety climate: Here safety climate was scored a top score for validity and prediction, but zero for objective (due to being based on perceptions).
Opinion/subjective based criteria-
Injury rates were rated as clear because they simply involve counting injuries and dividing by hours; however first aid injury received a lower score due to confusion around differing definitions. Rates were rated as moderately functional as they’re easy and inexpensive to observe but are only retrospective and support reactionary action.
They were scored as moderately important because while they represent adverse impacts to human life, they’re statistically unstable which limits their utility in organisations.
Near misses: These received a low score for clear because of lack of a consistent definition. Their functionality was rated as low because of low confidence that all near misses are being reported. They were generally viewed positively but are fraught with problems, like directionality—is a high near miss incident rate a good sign of reporting or a poor sign of conditions? Hence near misses received a low score for importance.
Leading indicators: These received a low score for clear because of high variation in how leading indicators are measured and reported.
They also received a low score for functionality, since there’s no standardised protocol to measure or report leading indicators and how well the activities are performed (as they’re mostly based on counting the frequency of things, e.g. # of toolbox talks or management visits rather than the quality of those activities).
They were rated as moderately important because of diverging views on what makes an activity leading, what indicators should be used etc.
Precursor analysis: These were seen as a promising area, but scored low for functional and clear. It scored moderately for important because of evidence linking precursors to serious injuries and fatalities, but still being only an indirect measure.
Safety climate: This scored low for clear because “perceptions are fickle and highly subjective construct with no established psychometric scale that can be applied across different contexts” (p8). Also scored low for functional because measures represent just a single snapshot in time and with a relatively high cost of surveys.
It was rated as moderately important because it’s seen to “[reflect] elements of culture and the organization’s commitment to safety” (p8).
Strategic combinations of metrics
Next the authors discuss the “strategic combination” of metrics and how to buttress the relative weaknesses of indicators to be more complimentary. They use groupings of radar graphs to highlight the evaluation performance of each indicator, so this section I describe will be clearer if you can access the paper.
Nevertheless, they argue that “Although combining metrics does not inherently address the limitations of any one metric, having multiple metrics with balanced strengths and weaknesses may provide information that is more complete” (p8).
Examples include: (minus the explanations for why, which is in the paper)
· Combining TRIR with leading indicators, which provides coverage over much more of the radar diagram
· Fatality rates and precursors are complimentary
· Safety climate and first aid are another example of strategic combination
· Indicators that share similar strengths and weaknesses don’t synergise well. For example DART and TRIR (both share data related to rare and statistically insignificant incidents), or safety climate and precursor scores (both share objective components but also share rather unstable subjective criteria)
Overall, they state that these findings revealed that “no metric was strong in all evaluation criteria, but that complementary strengths may yield synergies among multiple metrics (e.g., TRIR and leading indicators) despite their individual weaknesses” (p9, emphasis added).
Notably, “Rather than considering one metric as superior to another, it may be more appropriate to explore how multiple metrics provide a more holistic understanding of the safety system” (p9).
Authors: Erkal, E. D. O., Hallowell, M. R., & Bhandari, S. (2023). Journal of Safety Research.
Study link: https://doi.org/10.1016/j.jsr.2023.04.005
Link to the LinkedIn article: https://www.linkedin.com/pulse/formal-evaluation-construction-safety-performance-case-ben-hutchinson

One thought on “Formal evaluation of construction safety performance metrics and a case for a balanced approach”