This study explored safety performance and network resilience among construction teams. Data came from three mega-projects in the Middle East using Social Network Analysis.
Resilience (** capacity for resilience) was observed via actual safety performance data and overall network resilience, simulation through agent-based modelling.
Providing background:
- They argue that different interpretations exist surrounding accident reporting. For some, greater numbers of incident reports can indicate better reporting environments. On the other hand, it can also be an increase in reportable events
- The reporting frequency may not also reflect the severity of incident potentials, where “an increase in reporting can a result of frequently occurring incidents with low consequences and not necessarily cover more severe incident occurrences”
- Modelling the networks of people and how they interact and communicate provides an alternate stream of data in organisations, indicating how a system actually performs
- Social Network Analysis (SNA) is one such method for analysing social interactions in complex systems. For terminology, nodes represent individuals in the network, and ties represent associations between individuals
- Average degree centrality measures the number of links an individual has with others. Higher numbers indicate more connections and more influence an individual has on a network
- Betweenness measures the number of node pairs that an individual connects or bridges; acting as an intermediary between those two individuals. Higher values indicate a higher influence of the intermediary individual, with higher power to control flow and interactions between other parties
- Closeness indicates the total number of links from an individual to another individual. Lower values indicate that one individual is more reachable by others
- Network density indicates how well connected and cohesive the network is (higher values indicate a better connected network), whereas average path length measures the number of links individuals need to reach each other, smaller values indicate better connectivity
- For network resilience – this is aligned to definitions from resilience engineering. Higher (capacity for) network resilience therefore allows an organisation to “keep, or recover quickly to, a stable state, allowing it to continue operations during and after a major failure or in the presence of hurdles”
- I’ve skipped most of the discussion around resilience engineering and network resilience
Results
Overall:
- Networks with better interaction and structure have higher resilience indices to risks
- Higher (network) resilience indices correlated with better actual safety performance
- Network structure, communication patterns and resilience shaped performance on the projects, and thus “A more cohesive network structure on a project implies better safety communication and more resilience toward safety risks”
- Also “The stronger the network, the better its ability to respond to safety problems, recover effectively, and proactively engage in avoiding future occurrences”
The findings suggest that “Better resilience is then directly associated with improved safety performance”
Discussing specific findings, management personnel were generally found to have the biggest node sizes, and hence represented the most influential individuals within each network.
On one of the mega-projects, the network was centralised around the HSE supervisor, followed by the HSE Manager. The authors note that “This can be associated with the fact that all safety communication and reporting on the project passes through the HSE supervisor and as a result of organizational hierarchy”.
In this context, the HSE staff played a “brokerage role” and bridged communication between different parts of the network; highlighting their contribution in maintaining strong communication within the system.
The authors then discussed differences between the mega-projects in network connectivity . I’ve skipped most of this, but needless to say that projects with impaired connectivity, low in betweenness and low in closeness indicated poorer communication potentials.
An example of the information network flow is shown below:
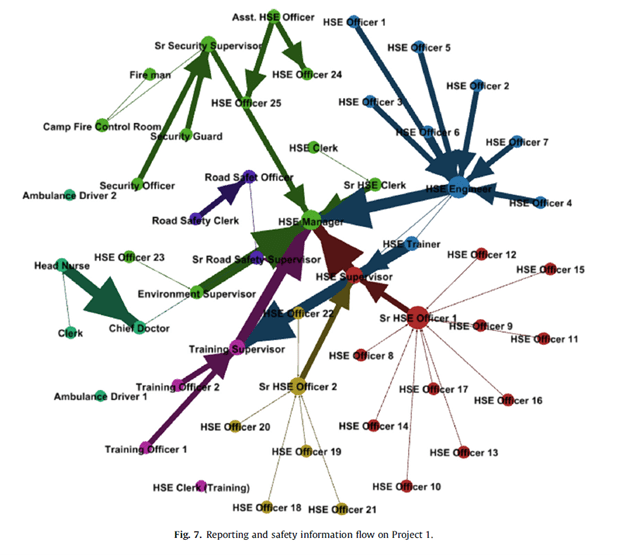
Project 1 was found to have higher capacity for resilience than the other projects, with a relatively high deviation reporting rate (reported performance deviations in a given time). The higher betweenness and lower closeness on project was indicative of project 1’s ability to better communicate across the network, even to the fringes (like more isolated subcontractor crews), which was more of a problem on the other projects.
I’ve skipped most of the specific resilience-orientated discussion points of the system, so check out the paper if you’re interested.
As noted above, the “safety system in the case company is shown to be centralized on the upper management rather than being a shared responsibility”. Hence they advise of more collaborative projects to build connections with frontline operators.
They argue that the “resilience metrics calculated for all networks also confirm that a stronger communication structure ensures better safety management via robust bonds among individuals.”
Project 1 again highlighted the relationship between having the highest capacity for resilience and subsequently the best overall safety performance (among several indices). Further, “When preparedness and resilience ratios increase, results of this study show that safety indices turn out to be better”.
They argue that a “resilient network develops resistance to failures as it is shown to build up barriers and prevent recurrence of problems through a continuous learning process. Therefore, resilience is associated”.
Nevertheless, these results “do not give a global view of all projects and all cases, and they do not necessarily confirm that better resilience always translates into better safety performance”.
Limitations were present, of course. The authors also provided some alternative interpretations of their findings.
Authors: Wehbe, F., Al Hattab, M., & Hamzeh, F. (2016). Exploring associations between resilience and construction safety performance in safety networks. Safety science, 82, 338-351.
Study link: https://doi.org/10.1016/j.ssci.2015.10.006
LinkedIn post: https://www.linkedin.com/pulse/exploring-associations-between-resilience-safety-ben-hutchinson

One thought on “Exploring associations between resilience and construction safety performance in safety networks”