This full open access paper is an interesting read. It explored the role of metaphors in safety.
Specifically, they discussed:
1) how metaphors influence the comprehension of organizational accidents
2) how graphical representation of metaphors shape observer comprehension of accidents
They note that current sociotechnical systems are characterised by complex interactions and pose a challenge in their design and management, but also in their representation.
Metaphors have been used to help conceptualise safety in complex systems, and often via capturing visual facets of complex system functioning.
According to “Le Coze (2019), accident metaphors have played a significant role in establishing safety as an independent field of research”.
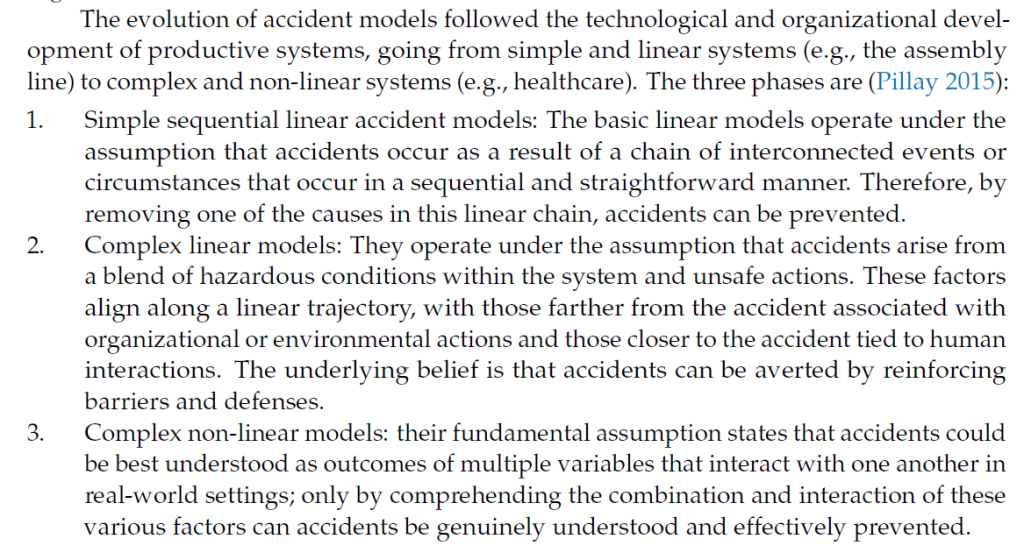
They start with dominos and triangles. Suggesting “interconnected failures” and “symbolized by the dominoes arranged consecutively, begets a temporal dimension”; hence framing accidents sequentially. While it has said to have been useful, it has two key drawbacks 1) misattribution of causation, 2) oversimplification.
Next they explore the Swiss Cheese metaphor and defences in depth; said to be an evolution of linear thinking. It sees accidents as a “concatenation of multiple failures”. It’s said to have been useful for explaining organisational failures and latent factors, but has several limitations in their view.
These include: 1) having a superficiality, such that it’s useful as a broad concept but not for practical applications [** although HFACS was able to operationalise it], 2) a dichotomy of normal vs pathological, right and wrong, such that there are “no “good” holes”, 3) once visually represented, “activates a frame that may bias operators … in looking for a linear and sequential chain linking visible holes”.
Next they look at FRAM. Some limitations of the metaphor is linked to its complexity, where “users cannot grasp patterns and have insights looking at the intricate web of connections”, 2) limited in capturing and visualising system variability.
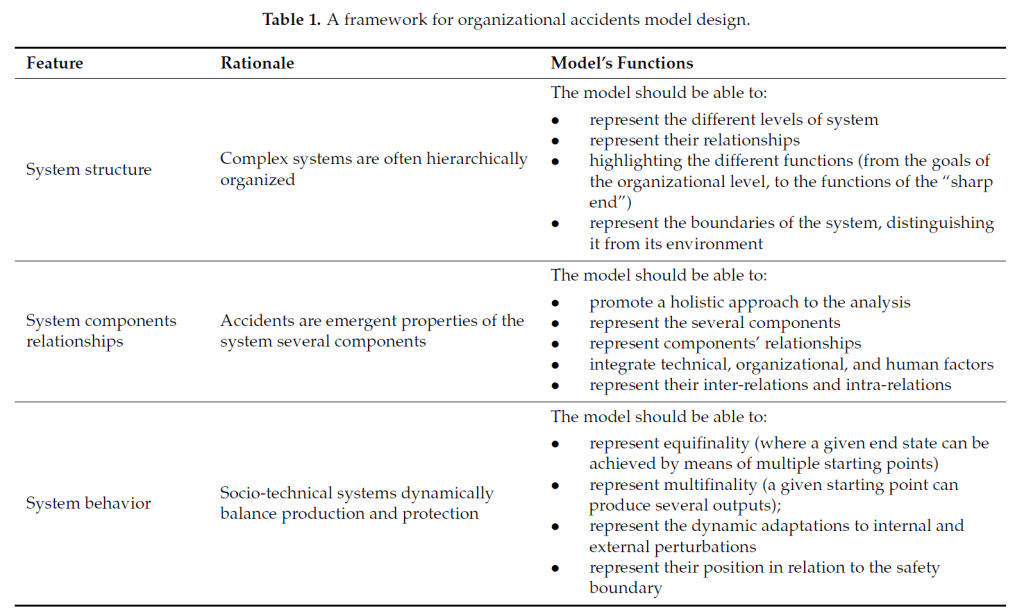
They then provide some thoughts moving forward, like some suggested criteria with any new model and metaphor (see final image).
Authors: Bracco, F., & Ivaldi, M. (2023). How metaphors of organizational accidents and their graphical representations can guide (or bias) the understanding and analysis of risks. Journal of intelligence, 11(10), 199.
Study link: https://doi.org/10.3390/jintelligence11100199

One thought on “How Metaphors of Organizational Accidents and Their Graphical Representations Can Guide (or Bias) the Understanding and Analysis of Risks”