What’s the relationship between safety professionals and incident frequency?
I was reminded recently (thanks Stuart Hughes) that I ran a simple project a while back looking at if there was any guidance or evidence behind the effects of safety professionals on incidents, and whether having more or less changes the impact.
I didn’t find much quality research, and what I found was a bit weak on methods.
Moreover – there’s the legacy questions on how useful is incident data, and how much we can trust it.
Nevertheless, this is what I found:
· Some research has studied the links between “staffing for safety” and accident rates, using the ratio between workers and safety professionals
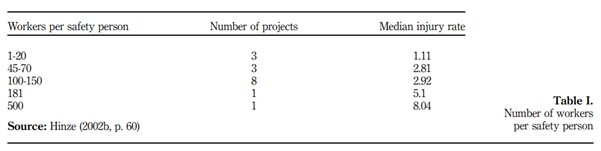
· A US study (Hinze, 2002) found that a greater ratio of safety professionals to site workers resulted in improved injury rate performance (up to a threshold level)
· Using a ratio of 1:50 (one safety professional to fifty workers), organisations with ratios over 50 had higher accident rates than those with below 50 (see image 1 for the links between number of workers per safety person)
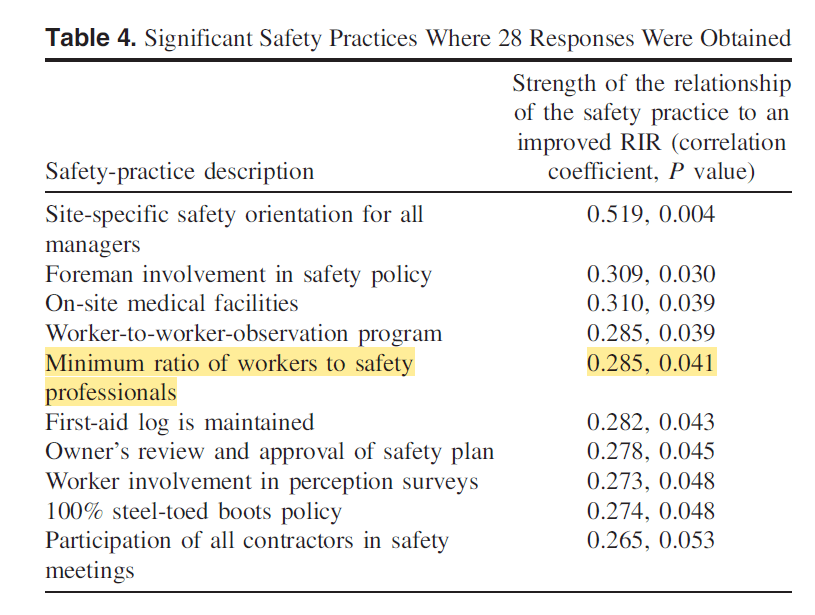
· Hinze et al. 2013 found a minimum ratio of workers to safety professionals was linked to improved recordable injuries (image 2), and when a contract set a minimum ratio of safety supervisors to workers
· A higher injury rate in organisations/projects utilising external safety professionals compared to internally employed safety professionals (Cameron et al. 2007)
· A moderate strength relationship of hiring a larger number of certified safety representatives relative to workforce size (acting as a leading indicator; Cameron et al., 2007)
· Statistically significant links between higher investment in health and safety professionals (training, certifications etc.) and better injury performance
· Inconsistent findings between staffing for safety and safety performance. One study questioned the direct and linear links between staffing for safety and accident rates, contradicting the study above (which found a positive linear relationship between a higher ratio of safety professionals and workers)
· Some overseas jurisdictions legislate at least 1:50 or 1:100; whereas some organisations set minimum ratios of 1:200 in manufacturing and 1:50 in high risk construction work
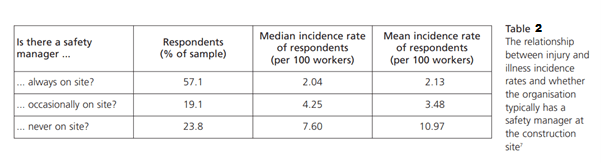
· One study (Abudayyeh et al., 2006) found a linear positive relationship, with better safety performance related to the more time that safety professionals were on site (image 3)
· This suggests that it is more important what safety professionals do, rather than blunt calculations of how many are employed
· An equation for calculating H&S staffing needs also exists – which factors in eight weighting factors (including number of employees, degree of hazards). This equation has come under some criticism
References:
Cameron, I., Hare, B., & Duff, R. (2007). Superior safety performance: OSH personnel and safety performance in construction. IOSH.
Hinze J. Making zero injuries a reality, RR160-11. Austin, Texas: Construction Industry Institute, 2002
Cameron, I., Hare, B., & Duff, R. (2007). Superior safety performance: OSH personnel and safety performance in construction. IOSH.
Hinze, J., Hallowell, M., & Baud, K. (2013). Construction-safety best practices and relationships to safety performance. Journal of construction engineering and management, 139(10), 04013006.
Cameron, I., Hare, B., & Duff, R. (2007). Superior safety performance: OSH personnel and safety performance in construction. IOSH.
Abudayyeh O, Fredericks T K, Butt S E and Shaar A. An investigation of management’s commitment to construction safety. International Journal of Project Management 2006; 24 (2): 167–174.
