
I knocked this up over the weekend and thought it would interest people – studied the patterns of natural and human-induced disasters from 1900 to 2024.
I’m focusing more on the human-induced/human-made disasters.
Some findings:
· Asia reported the highest number of air disasters, then Europe, NA and the fewest in Oceania
· NA recorded the most chemical spills, whereas Asia led in industrial collapses
· Asia led with industrial explosions, and NA the most industrial fires
· Rail and road disasters were more prevalent in Asia and Africa, with rail more prevalent in Asia
· China ranked first with the total number of events (>7% of global total), with human-made accounting for ~49%; India was second and the US/NA third

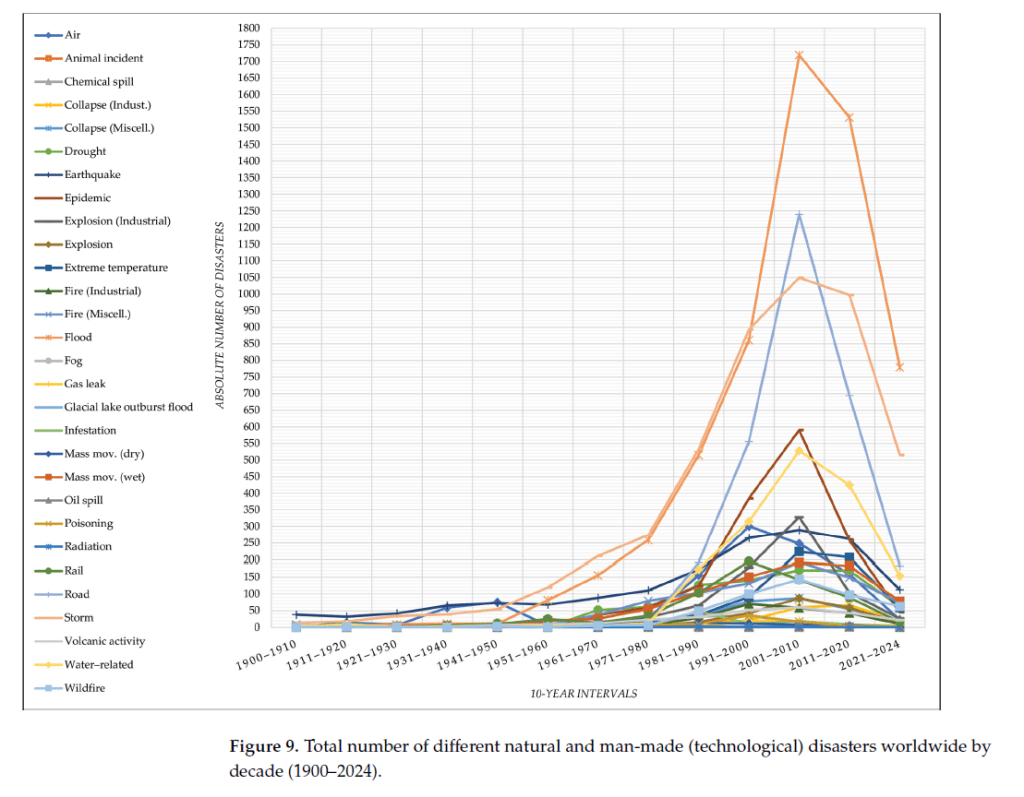
· The early 20th century (1900-1940) experienced relatively fewer disasters, but with a gradual increasing trend
· This is the period after which human-made disasters became prominent, peaking in the late 20th and early 21st , e.g. speaking in the 80s and 90s
· The recent decade 2021-24 shows a decreasing rate
· There is a strong relationship between disasters and socio-economic indicators and patterns, e.g. “significant negative correlation between GDP per capita (USD) and the total number of disasters (p = 0.140, r = −0.333)”
· “countries with a higher GDP per capita tend to experience fewer overall disasters and related impacts”
· This may be attributable to higher GDP countries allocating more resources towards disaster prevention [** or also perhaps outsourcing more of their hazardous industries offshore]
· However, no relationship was found “between GDP per capita and the number of people affected, deaths, injuries, natural disasters, or man-made disasters”, hence, “economic wealth alone may not directly lead to better outcomes in terms of lives saved”
· Quality of governance was also linked with the total number of disasters, and weakly related to reductions in injuries and fatalities
Unfortunately, I couldn’t see anywhere where they normalised the accidents against per capita. E.g. We’d expect China and India to have the highest total numbers because they also have the largest populations.
Also makes it difficult to spot differences in increases or decreases in disaster prevalence, since it may be more strongly linked to growth in population and size of the industry/s.
Still, if you want a consolidated source of disaster info, this paper is useful.
Ref: Cvetković, V. M., Renner, R., Aleksova, B., & Lukić, T. (2024). Geospatial and temporal patterns of natural and man-made (Technological) disasters (1900–2024): Insights from different socio-economic and demographic perspectives. Applied Sciences, 14(18), 8129.

Study link: https://doi.org/10.3390/app14188129
My site with more reviews: https://safety177496371.wordpress.com
