
How can we make risk matrices marginally more interpretable?
This study ran two experiments by changing the structure.
I’ve skipped heaps due to laziness.
PS. Check out my YouTube channel: https://www.youtube.com/@safe_as_pod
Extracts:
· They discuss the use of logarithmically increasing RM categories, which allows a comparison between risks that span several orders of magnitude
· But, even expert audiences struggle with log scales, with one survey study showing professional ecologists struggled with graphs using log-scales compared to linear, and among engineering students
· They discuss the value of geometric scales, where values increase in geometric values, e.g. 1, 5, 25, 125, 625 – noting it may aid interpretation
· Cell shape is also implicated in comprehension, where the spacing/tick marks help people understand plots with log axes
· E.g. cells to the top-right of the matrix are physically larger than those to the bottom-left, indicating a difference in scale
· They found that “there are changes to the standard format of qualitative and semiqualitative risk matrices (rectangular cells, linear scale labeling, use of a key) that may help them to communicate risk more effectively”
· Image 2 shows a combination of the potential recommendations
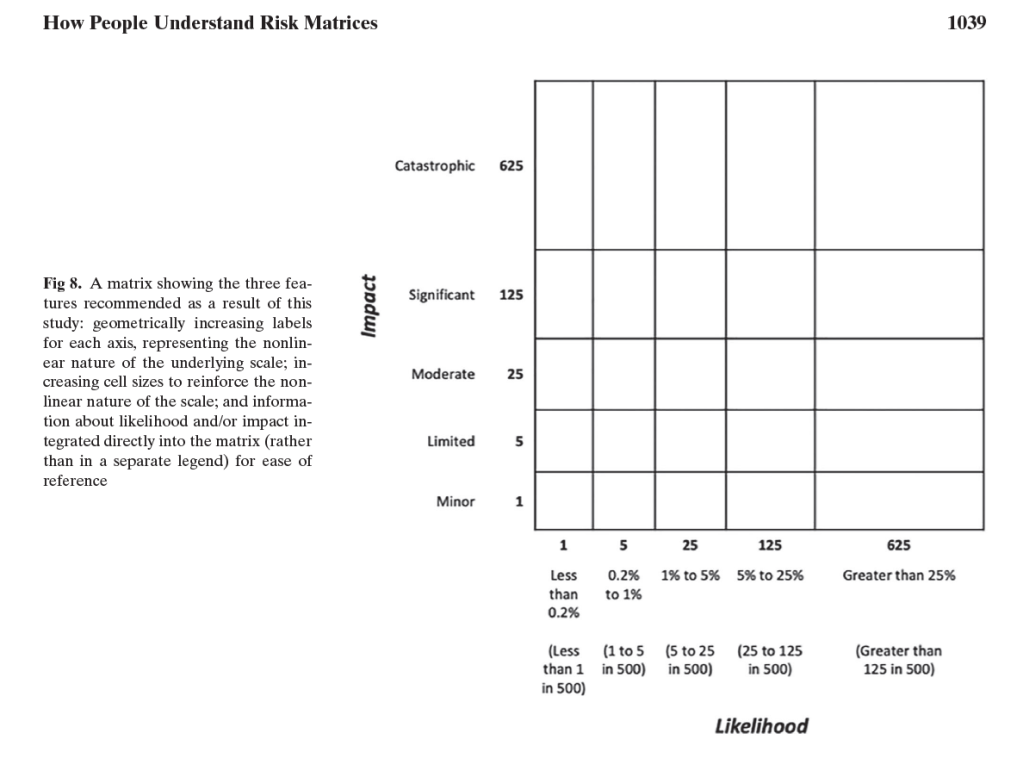
· “the primary recommendation for an improved risk presentation format is the use of ordinal, explicitly nonlinear scale labels for matrices with an exponential or otherwise nonlinear increase in likelihood and/or impact along the axes”
· “These types of scales represent the nonlinear change from one cell to another by increasing in a suitable geometric progression”
· “Evidence … also suggests a possible benefit of a “logarithmic” format with increasing spacing between lines, although it should be emphasized that this may not be true for people who are already familiar with risk matrices”
· “It may be worth considering integratingcany information currently in a key onto the matrix,cwhere this is graphically reasonable”
· “Some of these changes (logarithmic matrix; integrated information) may not be subjectively preferred by users on first experience despite their benefits, but opinions are likely to improve swiftly with familiarity”
· “In this pair of online experiments (total n = 2699), we show that risk matrices are not always superior to text for the presentation of risk information, and that a nonlinear/geometric labelling scheme helps matrix comprehension (when the likelihood/impact scales are nonlinear)”
Study: https://doi.org/10.1111/risa.13822
My YouTube: https://www.youtube.com/@safe_as_pod
My site with more reviews: https://SafetyInsights.org
Shout me a coffee: https://buymeacoffee.com/benhutchinson
Safe As LinkedIn group: https://www.linkedin.com/groups/14717868
