

A response from Kjellén to Hopkins’ 2009 article about indicators (link in comments).
[See week’s compendium dedicated to Hopkins & Hale]
Extracts:
· “LTI-rate gives the same weight to injuries with dramatically different consequences; that the measure is easily manipulated; and that natural statistical fluctuations make it useless for feedback control of other than the largest workplaces”
· Kjellén defines a safety indicator, as “the metric used to measure the organisation’s ability to control the risk of accidents”
· “this means to measure directly or indirectly the level of risk of accidents (probability, consequence) and how this develops over time”
· Leading indicators therefore “changes before the actual risk level has changed. This interpretation is consistent with the definition of leading indicators in economy but deviates significantly from .. interpretations [used in safety]”
· E.g., leading indicators should provide intel before risk actually changes
· For Hopkins, “lagging indicators [tend] to be ‘‘direct measures of harm [or loss] .. Typical loss indicators in the personal safety field are the fatal accident rate, the lost-time injury (LTI) frequency rate and the total recordable injury (TRI) frequency rate”
· “Hopkins makes the distinction between process and personal safety hazards”, and sees personal safety hazards as those that “affect individuals but may have little to do with the process activity of the plant”. This dichotomy is too simplistic”
· Kjellén instead offers the energy model from Gibson & Haddon, where loss results from “a transfer of energy to the victim in excess of body injury thresholds”
· Hence, “An accident is, with few exceptions, characterised by the loss of control of energies or of the victim’s position in relationship to the energy flow”
· “In major accidents, a large amount of energy is released causing multiple fatalities [and major damage]. All these different types of accidents also have their specific precursor. It will not be possible to develop leading [indicators] unless the relationships between losses, types of energy involved and precursors are well enough understood”
· “Hopkins argues that ‘‘the strategy should be to move upstream in the chain of precursor events only as far as is necessary to identify countable occurrences”
· However, “The further upstream we move from the loss, the less certain we can be about the validity of our measures as to the risk of accidents”
· Relationships between indicators and SMS elements have been challenging, because “The positive relations, if any, have been weak because of the general nature of the contributing factors and the high level of aggregation of the accident data”
· “LTI-rate has been notorious for its poor reliability and lack of robustness against manipulation, and this was one of the main reasons why the TRI-rate was introduced”
· Next Kjellén discusses the problems with safety performance measures and incentives/renumeration, noting “people should be careful in introducing accident and incident frequencies in the remuneration packages to avoid corrupting the data”
· “Robustness against manipulation should be an important criterion in the selection of safety performance criteria for use in incentive schemes”
· “One of the main objections against the LTI-rate has been its delayed feedback on safety performance” (image 2)
· In image 2, the “links between size of a company and the periodicity needed to produce meaningful time series of the LTI-rate (assuming an LTI-rate of 20)”
· “For a company with 100 employees, for example, it is not worth while to calculate the LTI-rate more often than about every 18th month. If the LTI-rate goes down, the period becomes even longer. The same principles apply to the TRI-rate”
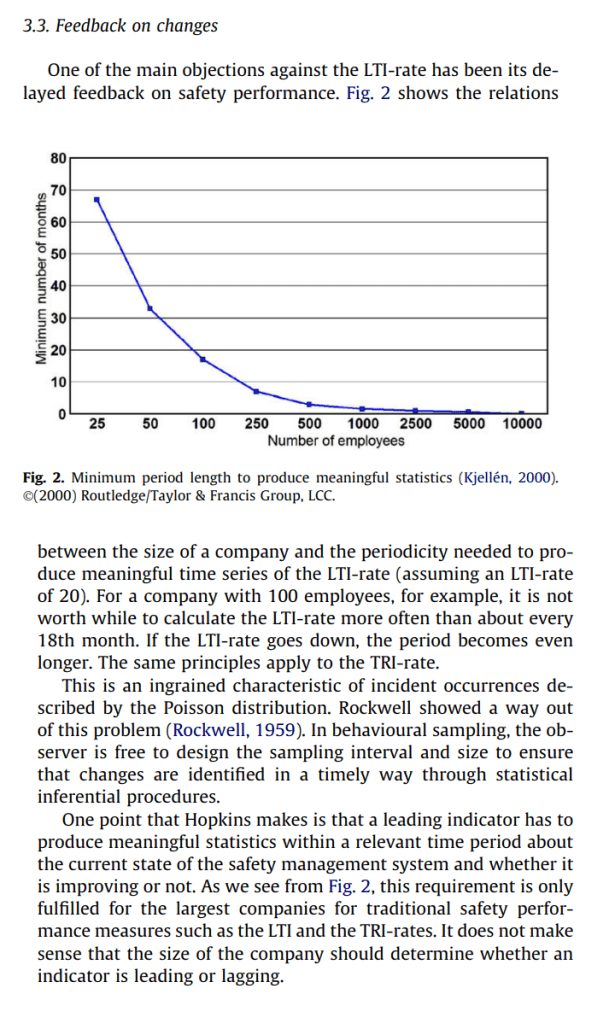
· “This is an ingrained characteristic of incident occurrences described by the Poisson distribution”
· One “way out of this problem … is [behavioural/workplace sampling, where] the observer is free to design the sampling interval and size to ensure that changes are identified in a timely way through statistical inferential procedures”
· Problematically for LTI etc., these do not produce “meaningful statistics within a relevant time period” for all but the largest companies
· Criteria for good safety measures from Rockwell 1959 are quoted (image 3)
· LTI etc. are popular because, in part, it’s “transparent and relatively easy to communicate and understand”
· And efforts to produce better measures have “resulted in increased complexity and less obvious relations between indicator and the risk of accidents”


Study link: https://doi.org/10.1016/j.ssci.2008.07.023
Hopkins’ article: https://www.linkedin.com/pulse/thinking-process-safety-indicators-ben-hutchinson-3vpgc
